Validating Events
Algolia provides powerful APIs to track and understand your users’ behaviors. When you send events to the Insights API, the Analytics API calculates and exposes metrics such as click-through rate, conversion rate, and no results rate.
To calculate these metrics accurately, you need to send events correctly. Because different event types require specific information, it’s best to send events using the API clients and InstantSearch libraries. The clients offer distinct methods for sending different event types, reducing user error.
To validate your implementation, Algolia provides two tools: the Insights API Logs on the Algolia dashboard and a Chrome extension.
Insights API Logs
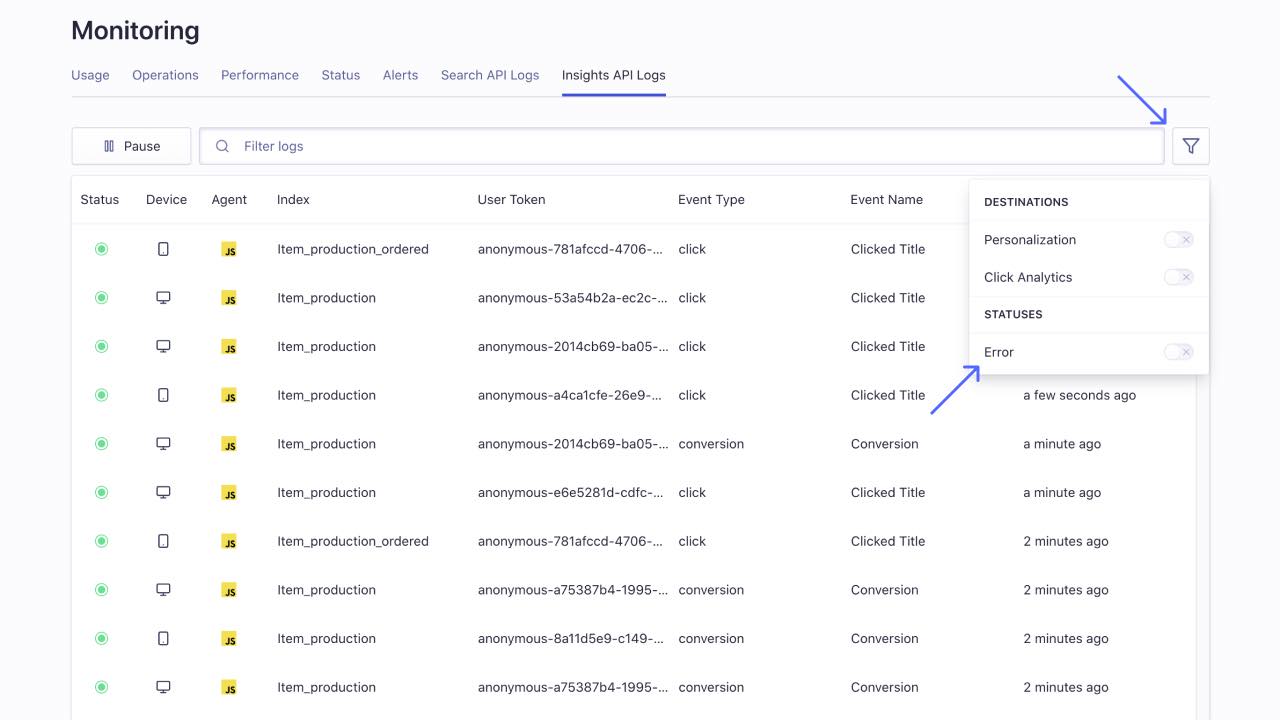
The Algolia dashboard displays events as the Insights API receives them. You can find these logs in the Monitoring section in the Insights API Logs tab.
By default, the logs include these fields:
- Status - the HTTP response status code for the event
- Device - whether the event originated from mobile or desktop
- Agent - the Algolia Insights API client used to send the event
- Index - the associated Algolia Index
- User Token - the
userTokenincluded with the event - Event Type - view, click, or conversion
- Event name - the
eventNameincluded with the event - Received at - when Algolia received the event
You can choose to display specific fields or filter on specific values for any of the fields.
For example, you may want to filter on status=4XX to see which events resulted in an error. You can do this by typing status=400, or any other status code, into the search input or selecting the filter icon and toggling on Error under Statuses.
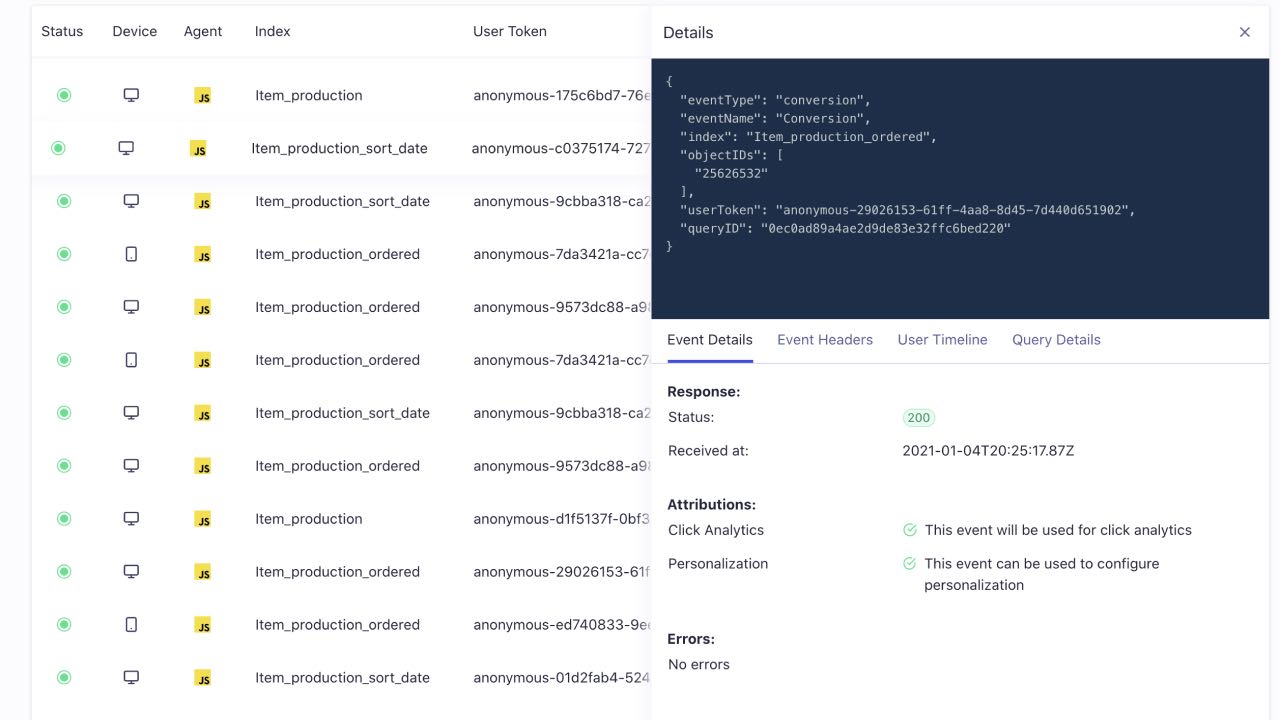
You can also click on any event to see more detailed information such as:
- Event Details - this includes whether the event can be used for Click Analytics and Personalization and any errors the event caused
- Event Headers - the referer, Algolia agent, and user agent
- User Timeline - what other actions the user took, and where this event falls in the timeline
- Query details - the request and response JSON payloads
Insights Validator Chrome extension
The Insights Validator is a Chrome extension that monitors all searches and events sent to Algolia and their relationships to one another. The Insights Validator gives you real-time feedback and links queries and analytics events together.
Installing the Insights Validator Chrome extension
You can install the validator from the Chrome Web Store. Head over to the extension’s page and click Add to Chrome.
Validating searches
You can try out the plugin on this website since it sends click events. Once you’ve installed the extension, you can trigger a search by typing into the search bar.
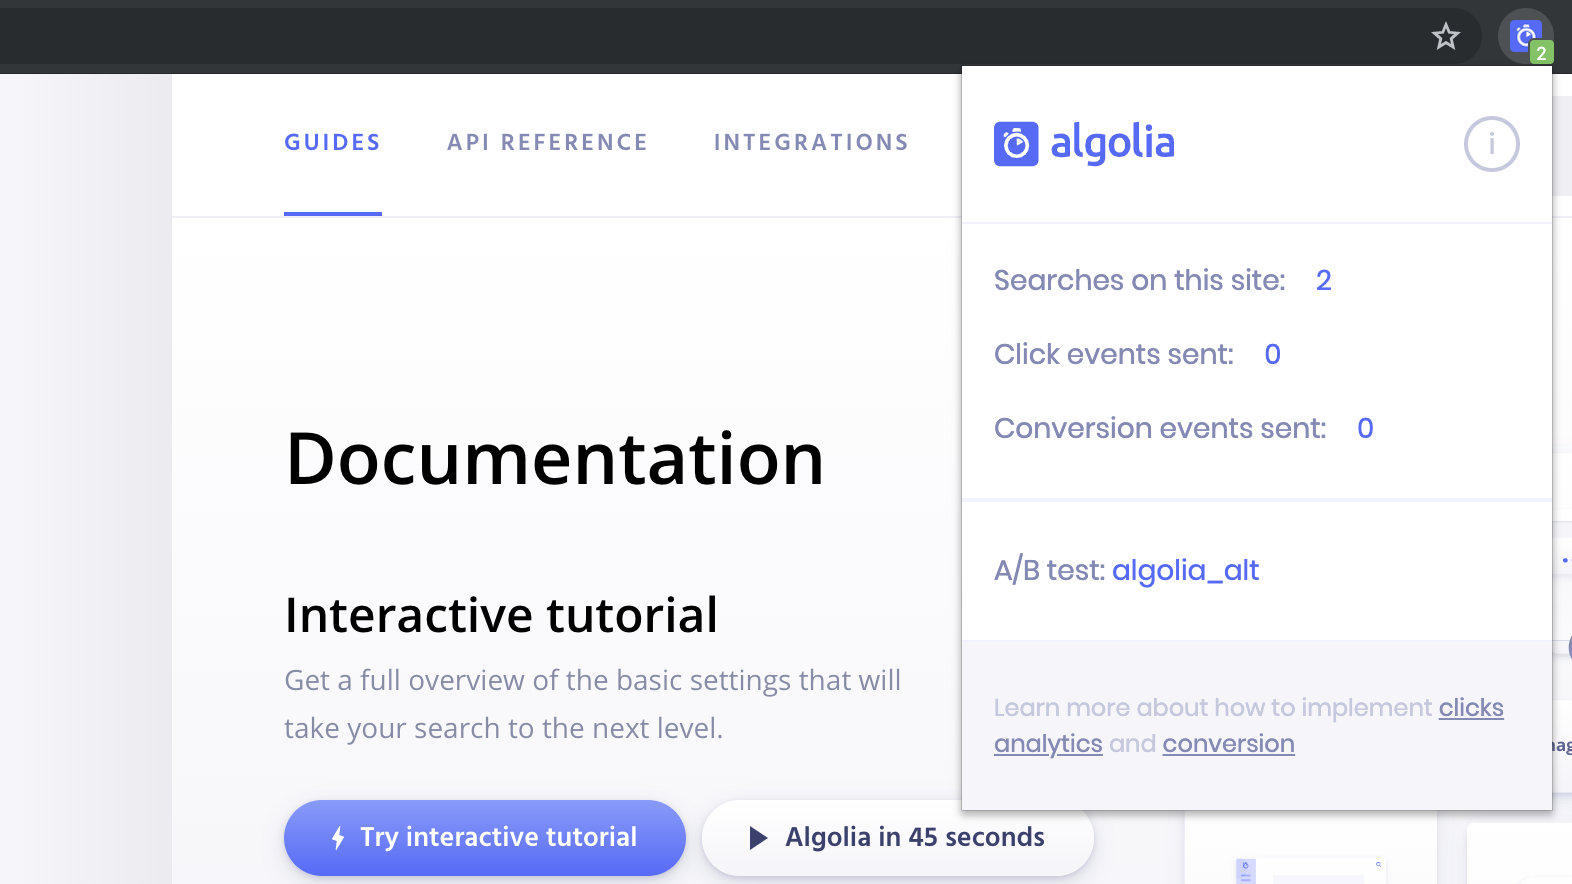
If you click on the plugin’s icon, you can see how many searches you made and that the website properly loaded the search-insights library.
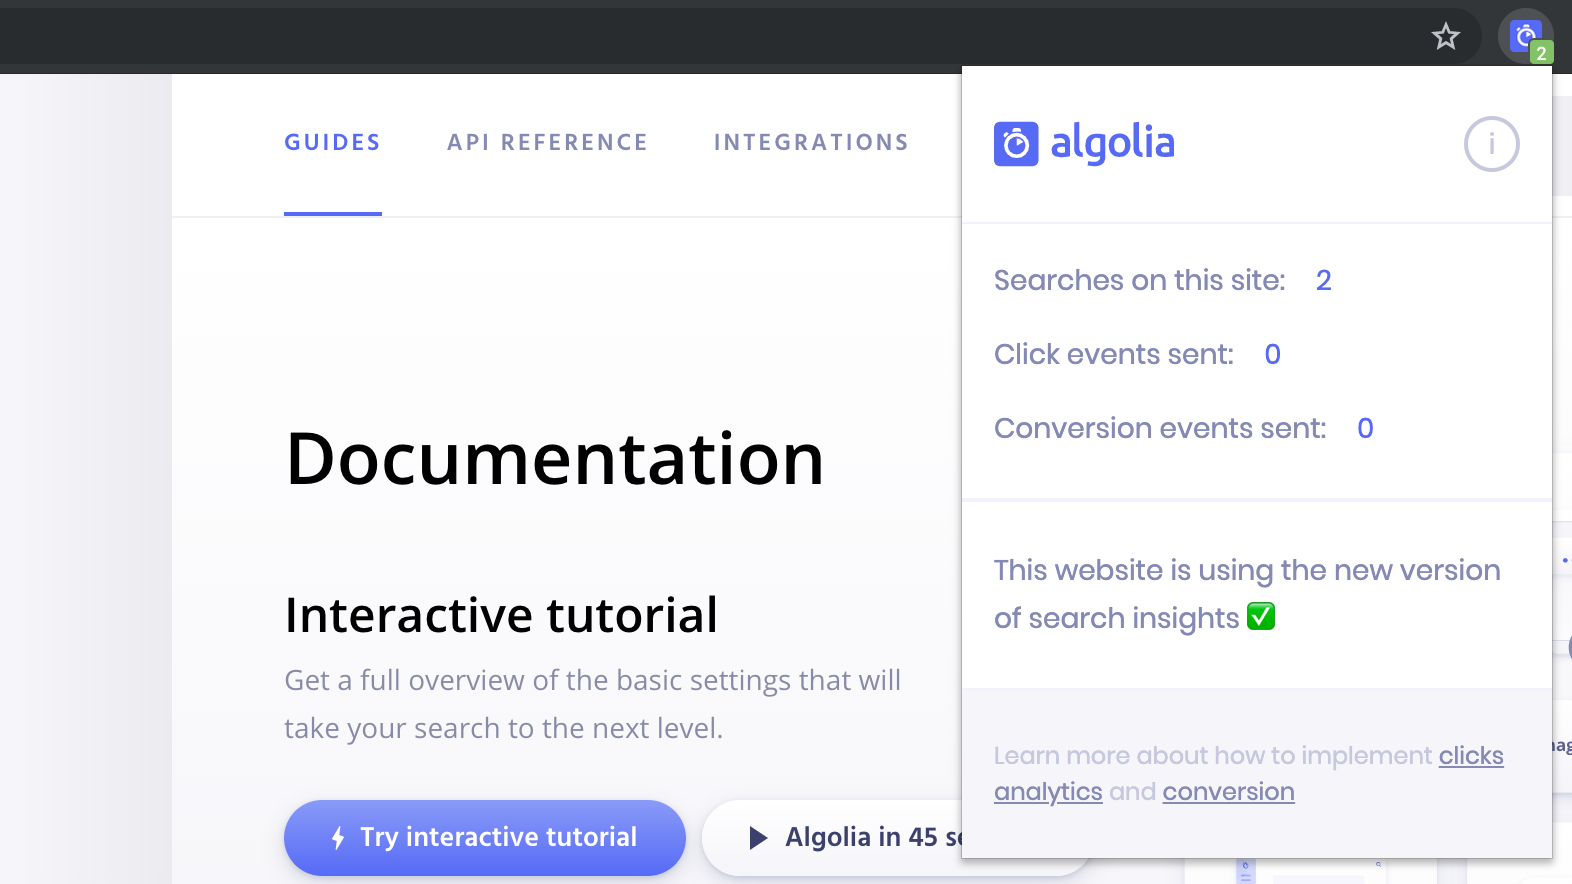
As you search and trigger events on the website, the popup displays the number of searches and events you’re sending to Algolia.
Validating the Insights library is properly loaded
The search-insights library allows you to send events to the Insights API. You may use any version, but the extension shows you a warning when you’re using an older version below 1.0.0.
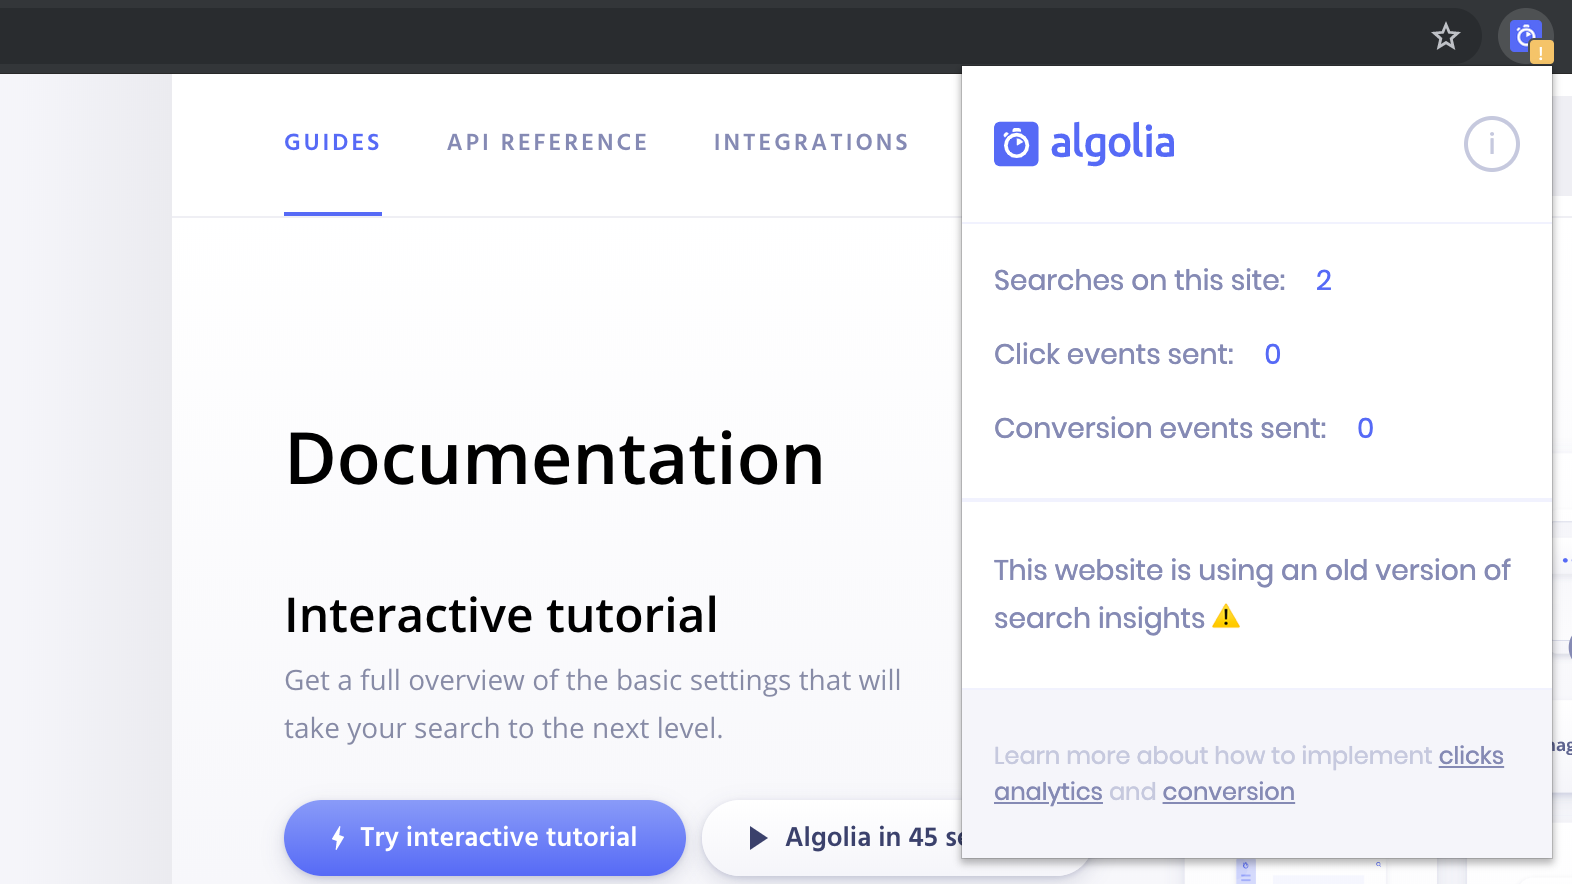
It’s best to keep your dependencies up to date and upgrade the search-insights library to the latest version.
Getting more details
While the popup provides general information, you need to open the Chrome DevTools and navigate to the Insights Validator tab to get a more detailed understanding of:
- what data you’re sending to Algolia,
- how searches and events are linked together.
If you make searches while on the Insights Validator tab of the DevTools, you can see them logged in real time. You can see more information by clicking on them.
Validating click and conversion events
Ensuring clickAnalytics is enabled at query time
When sending search-related events, the first step is to enable the clickAnalytics query parameter. From the DevTools, you can get a quick overview of which queries have clickAnalytics enabled.
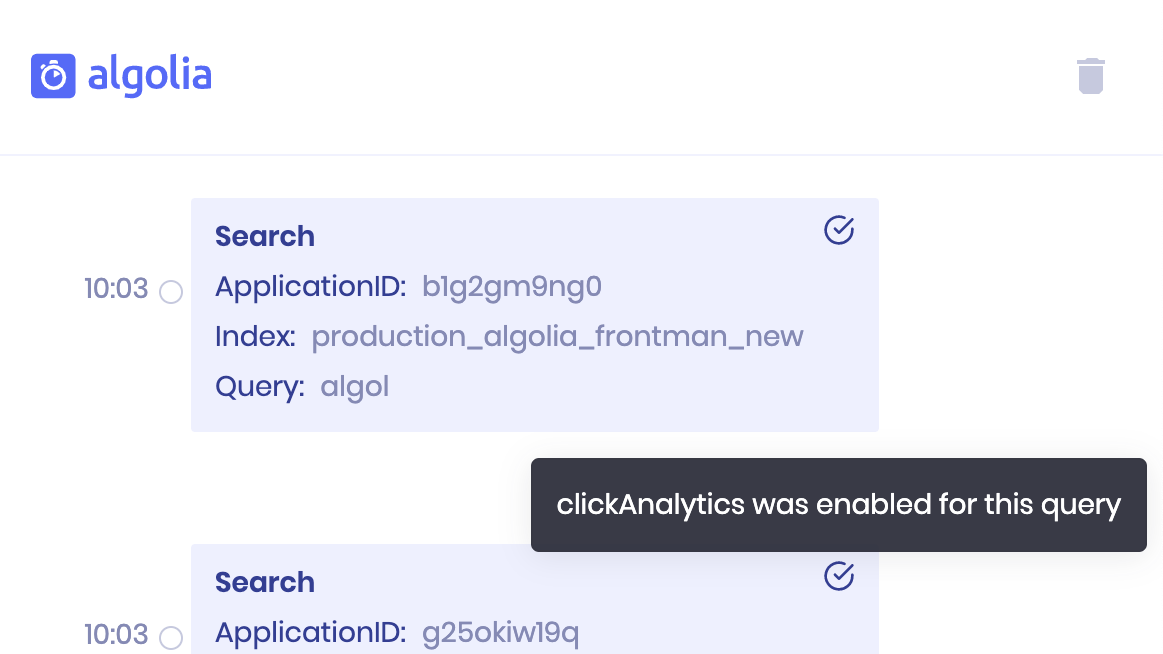
Clicking on any search event opens a small dropdown that displays extra information. You can see what analyticsTags were applied and what the generated queryID is. The queryID is essential for sending search-related events to the Insights API.
Validating click events
Once you’ve enabled the clickAnalytics query parameter, you can send search-related events. You can open the DevTools and monitor any event by clicking on its associated element.
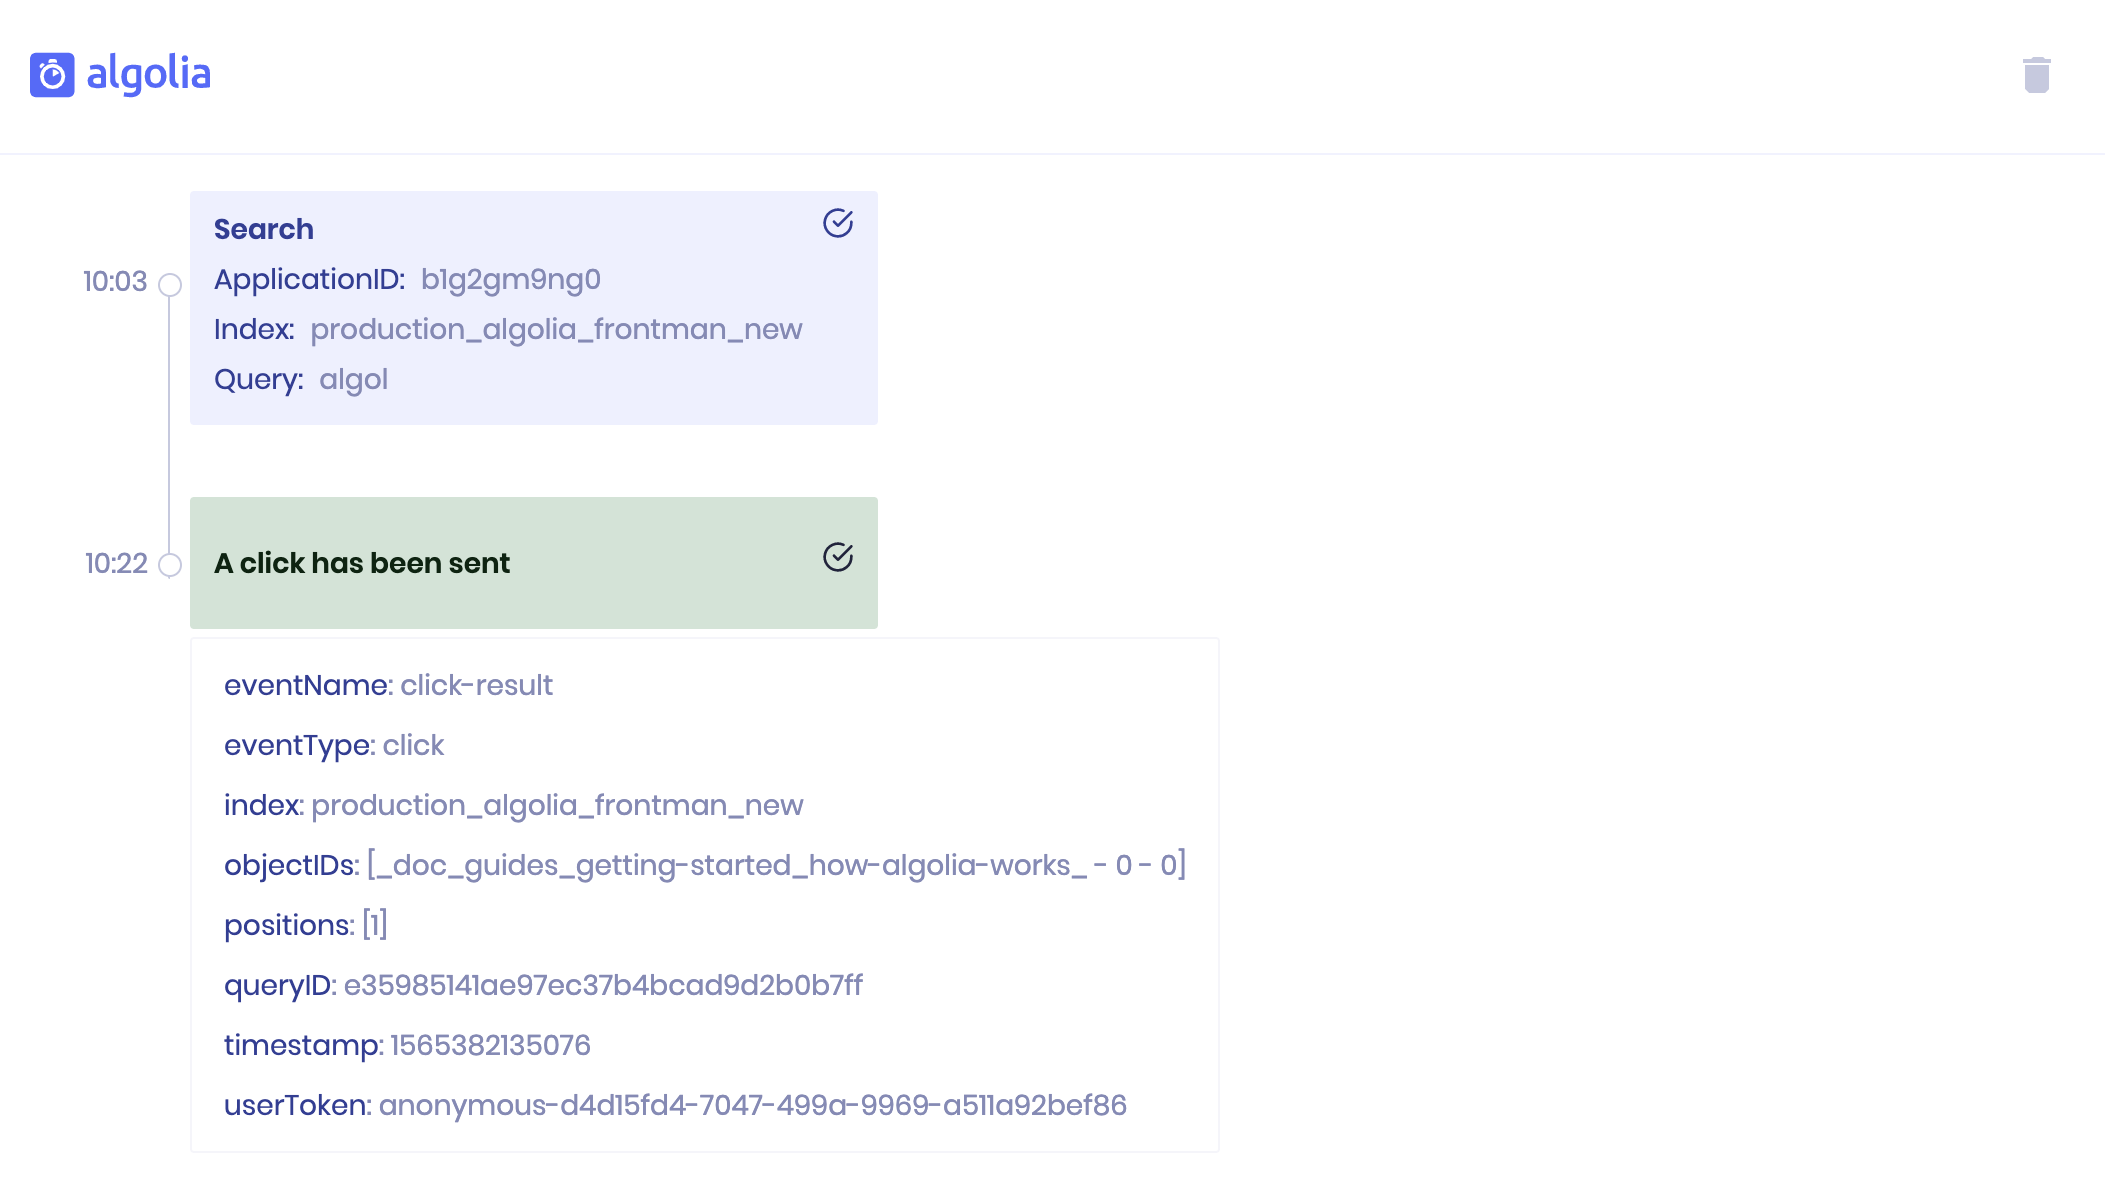
When a click event goes through, the extension reports it. It displays the included parameters such as:
userToken- required for all eventseventName- required for all eventseventType- required for all eventsindexName- required for all eventsqueryID- required for search-related eventsobjectIDs- required for item-based eventspositions- required for click eventstimestamp- recommended for all events
The Analytics API then uses this data to compute click-through rate, average click position, and a histogram of click positions for the current query.
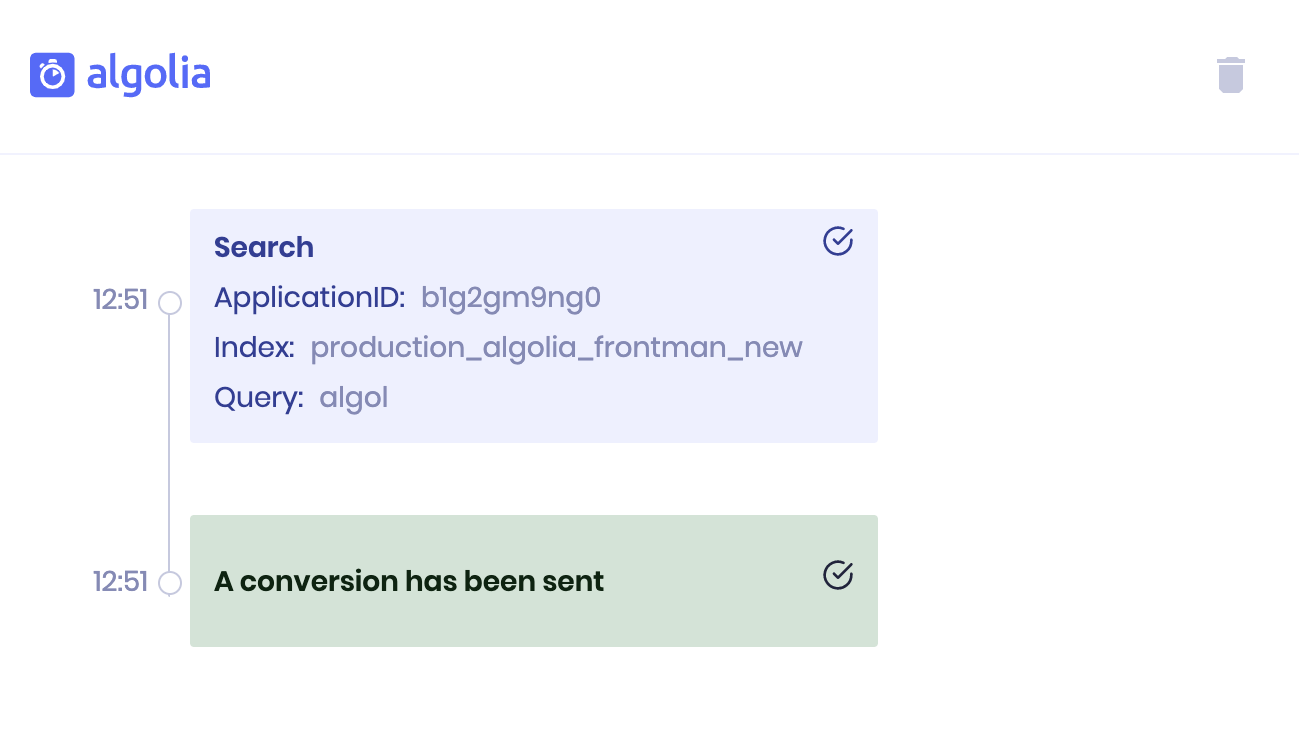
Validating conversion events
Conversion events work the same as click events. Triggering a conversion event with your DevTools open shows how searches and events are linked together.
Validating A/B tests
Without inspecting the API response for search requests your browser makes, you might not know when you’re querying an index where an A/B test is running. The extension shows you if an A/B test is running and on which index so that you can know how the results you’re seeing might be influenced.
FAQ
Why don’t I see any click analytics metrics in my analytics dashboard?
There may be a few minutes delay between the moment you send events and when the dashboard displays metrics. This delay is the time it takes to collect and compute metrics. It shouldn’t usually take longer than 15 minutes.
If you haven’t correctly configured your search or if you’re sending malformed data to the Insights API, you may not see any metric in your analytics dashboard.
Both the Insights API Logs and Insights Validator extension can help you validate your implementation. Please note that the Insights Validator only works if you’re using a front-end implementation.
First, validate that you’ve correctly loaded the search-insights library and that you’ve set the clickAnalytics parameter to true. Then you can check if you’re correctly sending click and conversion events. If you see events being dispatched in the Chrome extension, then click-through rates, conversion rates, and average click position metrics should appear in your analytics dashboard.
Why don’t I see any searches or events in the Chrome DevTools?
The extension only works for front-end implementations that use either the JavaScript client or one of the InstantSearch libraries along with the search-insights library. The Insights Validator doesn’t work with back-end implementations.
Using the InstantSearch libraries allows the Insights Validator to reliably listen for network requests and report your analytics data. It also minimizes human error. If you can’t use the libraries, please send feedback to support@algolia.com so we can understand what requirements the libraries don’t meet.
